Who Carries the Second Shift in Utah?
A 2025 Utah survey shows a clear gender gap in how fairly domestic labor and caregiving are perceived. National time-use data shows a separate, measurable gap in the time women and men spend on household work and primary childcare.

The second shift is not just a debate about who did the dishes. It is a question about how paid work, caregiving, household labor, and recovery time are distributed inside families, and what happens when those demands are not experienced equally.
Utah now has unusually useful perception data on this question. In fall 2025, the Utah Women & Leadership Project (UWLP) fielded an 83-item survey with two samples: a representative sample and a separate convenience sample. The two samples included 5,212 participants in total. For the home-and-family items, the number of respondents varied by question.
Methodology matters
For the clearest statewide comparison, this article leads with the UWLP representative sample rather than treating the combined representative and convenience samples as one population estimate. The combined sample is still useful descriptively, but the convenience sample was not designed to represent Utah as a whole.
The Utah perception gap is real, but the sample matters
In the representative sample, 47.3% of women said domestic labor in their home was shared equitably to some degree, compared with 67.2% of men. That is a 19.9 percentage-point gap. On caregiving, 47.3% of women expressed some level of agreement that the load was shared equitably, compared with 66.4% of men, a 19.1-point gap.
The percentages above combine “somewhat agree,” “agree,” and “strongly agree.” They come from item-specific representative-sample counts of 1,065 women and 880 men. These comparisons describe a difference in perceived fairness. They do not measure the actual number of minutes each person spent on chores or care.
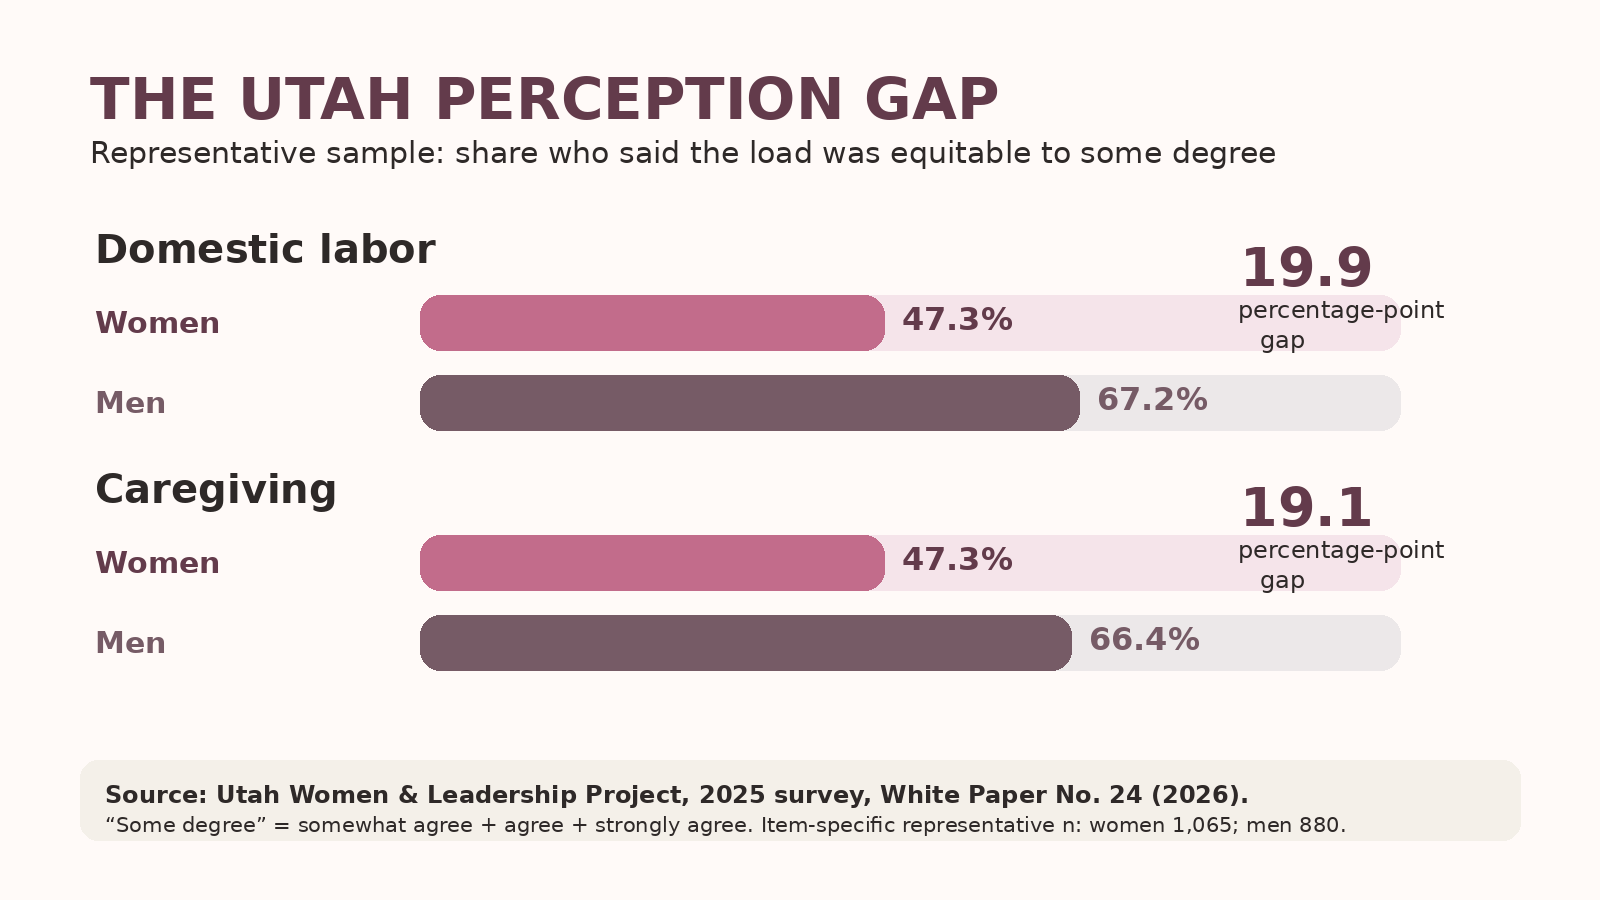
Representative-sample results from UWLP White Paper No. 24. Percentages shown are the share selecting somewhat agree, agree, or strongly agree.
Why you may see different Utah percentages elsewhere
UWLP also reports the representative and convenience samples together. In those combined samples, 56.2% of women and 69.4% of men expressed some level of agreement that domestic labor was shared equitably. For caregiving, the combined figures were 53.7% for women and 69.3% for men. Those figures are mathematically consistent with the report, but they should be labeled as combined-sample results, not as clean statewide population estimates.
What the survey can and cannot establish
The survey establishes a gender difference in how respondents perceive fairness inside the home. It does not establish that every Utah household is unequal, nor can it show exactly why two partners may describe the same division of labor differently. Perceptions can be shaped by workload, expectations, what counts as “work,” and which tasks are visible or remembered.
A national time-use check points in the same direction
Perception data and time-use data answer different questions, so they should not be treated as interchangeable. Still, the 2025 American Time Use Survey gives a useful behavioral benchmark. Across people age 15 and older, women averaged 2.38 hours per day in household activities, compared with 1.58 hours for men. That is an average difference of 0.80 hours per day.
Among adults living with children under 18, women averaged 1.74 hours per day caring for household children as a primary activity, compared with 0.99 hours for men, a difference of 0.75 hours per day.
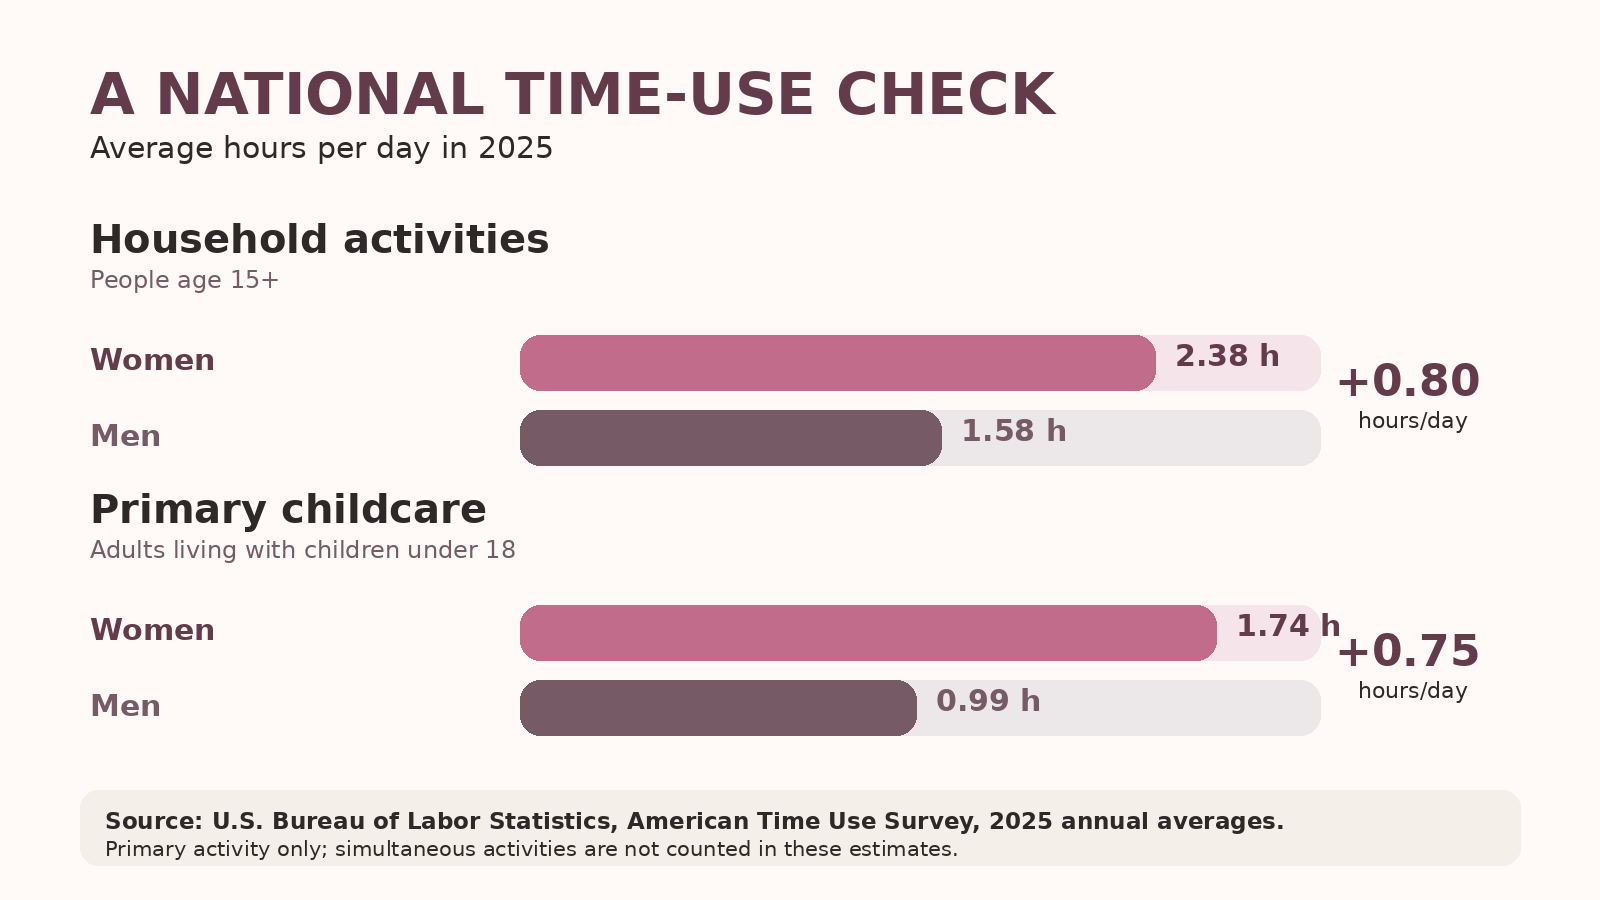
BLS 2025 annual averages. “Primary activity” means the person’s main reported activity; simultaneous activities are not included in these estimates.
Important limitation
The national BLS figures do not prove that a particular Utah couple divides labor this way. They describe average time use in the United States. The Utah survey, by contrast, measures perceived fairness rather than time spent.
Older Utah time-use estimates add context, not a 2025 measurement
A 2024 UWLP research snapshot reported that Utah women averaged 5.55 hours per day in unpaid work compared with 3.22 hours for Utah men, a wider gap than the national comparison used in that snapshot. The underlying Utah estimates came from pooled 2015-2019 American Time Use Survey tables, not from a 2024 or 2025 Utah time diary study.
That makes the snapshot useful historical context, but it should not be presented as a direct measure of Utah households today. The strongest current Utah evidence in this article is the 2025 perception survey; the strongest current behavioral evidence is national BLS time-use data.
Why unpaid work can become an economic issue
The economic mechanism is not that every extra household task automatically causes a pay gap. The evidence is broader and cumulative. OECD research finds that women, on average, spend more time in unpaid work, are more likely to work part time, and spend fewer hours in paid work than men. It links these patterns to lower earnings, weaker career prospects, and lower social-protection entitlements over the life course.
The OECD also identifies childcare access, family leave, long-term care, workplace flexibility, tax-benefit systems, occupational segregation, and gender norms as factors that can shape how paid and unpaid work are divided. In other words, household choices are real, but the options available to a household are also shaped by institutions and the labor market.
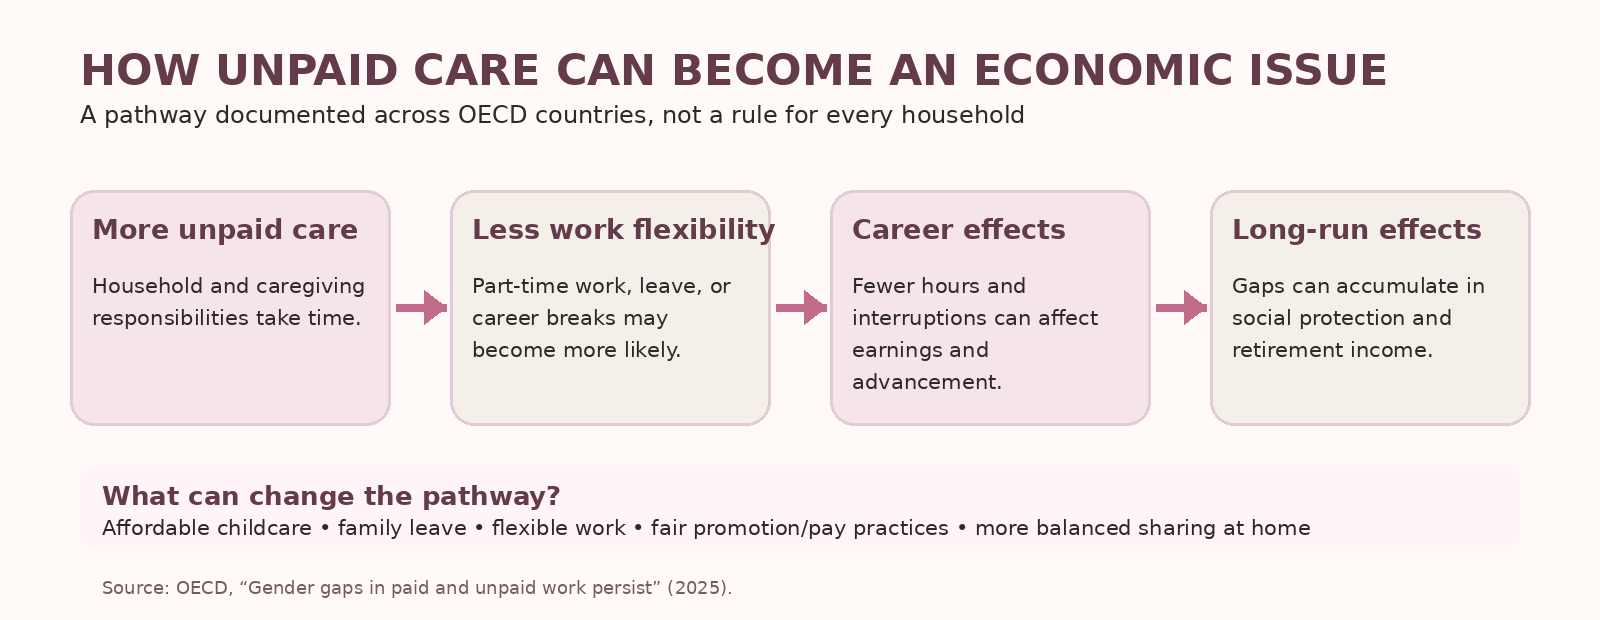
This is a population-level pathway described in OECD research, not a causal diagnosis of any individual family.
Where women and families have leverage in Utah
No public agency can decide how a private household divides chores. Public policy and employer practices can, however, affect how difficult it is to combine paid work with care. The most practical levers sit around the household: childcare affordability and availability, leave, scheduling flexibility, and whether workers who use flexibility face hidden career penalties.
Utah child care assistance
Utah’s Department of Workforce Services (DWS) administers child care assistance. DWS states that approved child care assistance is reviewed every 12 months and that the income limit during the review period is 85% of the State Median Income limit. Eligibility also depends on program-specific employment, household, and provider requirements. Families can use myCase to manage benefits and Care About Child Care to search for providers.
Public participation and oversight
The Utah Office of Child Care says its work is supported by several boards and commissions, with meeting times, agendas, minutes, and audio available through the office. For people who want to understand how childcare programs and rules are shaped, those public records are a concrete place to look.
Inside workplaces
Employers can also measure whether flexibility works equally in practice. Useful questions include whether promotion, retention, schedule access, or advancement outcomes differ by gender or caregiving status, and whether workers who use flexible arrangements experience a career penalty. Those are measurement recommendations, not findings about any specific Utah employer.
What Utah should measure next
Utah has current perception data, but it still lacks a recent, Utah-specific behavioral time-use measure that can be placed next to the 2025 survey. A stronger evidence base would track how much time Utah adults spend on household labor, childcare, eldercare, household management, and simultaneous care, then connect those measures to employment hours, labor-force exits, promotion, entrepreneurship, retirement savings, and childcare access.
That distinction matters. If women and men perceive the same household differently, researchers need to know whether the difference reflects actual hours, different categories of work, invisible planning and management, different expectations of fairness, or some combination of those factors.
The bottom line
Utah’s 2025 representative survey shows a clear perception gap. Roughly two-thirds of men in the representative sample said domestic labor and caregiving were shared equitably to some degree, while fewer than half of women said the same. National behavioral data independently show that women spend more average time than men on household activities and primary childcare.
Those findings do not tell us what happened in every Utah home, and they do not reduce family decisions to one cause. They do give Utah a better question than “Who thinks they do more?” The useful question is: What work is actually being done, who is carrying it, how is fairness being judged, and what would make families’ choices more workable?'
Sources and fact-check notes
1. Utah Women & Leadership Project, “Home, Health, Community, & Allyship 2025: Utahns’ Awareness, Understanding, and Attitudes,” White Paper No. 24, March 19, 2026. Open source Primary source for 2025 survey methodology and home/family tables.
2. Utah State University, “USU UWLP Publishes New Statewide Data on Home, Health, Community, and Allyship,” March 19, 2026. Open source Summary of the 2025 survey and total sample size.
3. U.S. Bureau of Labor Statistics, American Time Use Survey, 2025 annual averages: primary activities by sex. Open source Source for household activities: women 2.38 hours/day, men 1.58.
4. U.S. Bureau of Labor Statistics, ATUS Table 9, childcare by sex, 2025 annual averages. Open source Source for primary childcare: women 1.74 hours/day, men 0.99 among adults living with children under 18.
5. OECD, “Gender gaps in paid and unpaid work persist,” September 15, 2025. Open source Evidence on unpaid work, part-time work, earnings, career prospects, childcare, leave, and policy factors.
6. Utah Department of Workforce Services, Child Care Assistance. Open source Current Utah assistance, review, myCase, and provider-search information.
7. Utah Office of Child Care. Open source Current description of the office and its boards and commissions.
8. Utah Women & Leadership Project, “Unpaid Care Work Among Utah Women: A 2024 Update,” Research Snapshot No. 54. Open source Historical Utah time-use context; underlying Utah BLS figures are pooled 2015-2019 estimates.